
Computational approaches to understanding subduction zone geodynamics, surface heat flow, and the metamorphic rock record
Online and PDF versions of my dissertation.
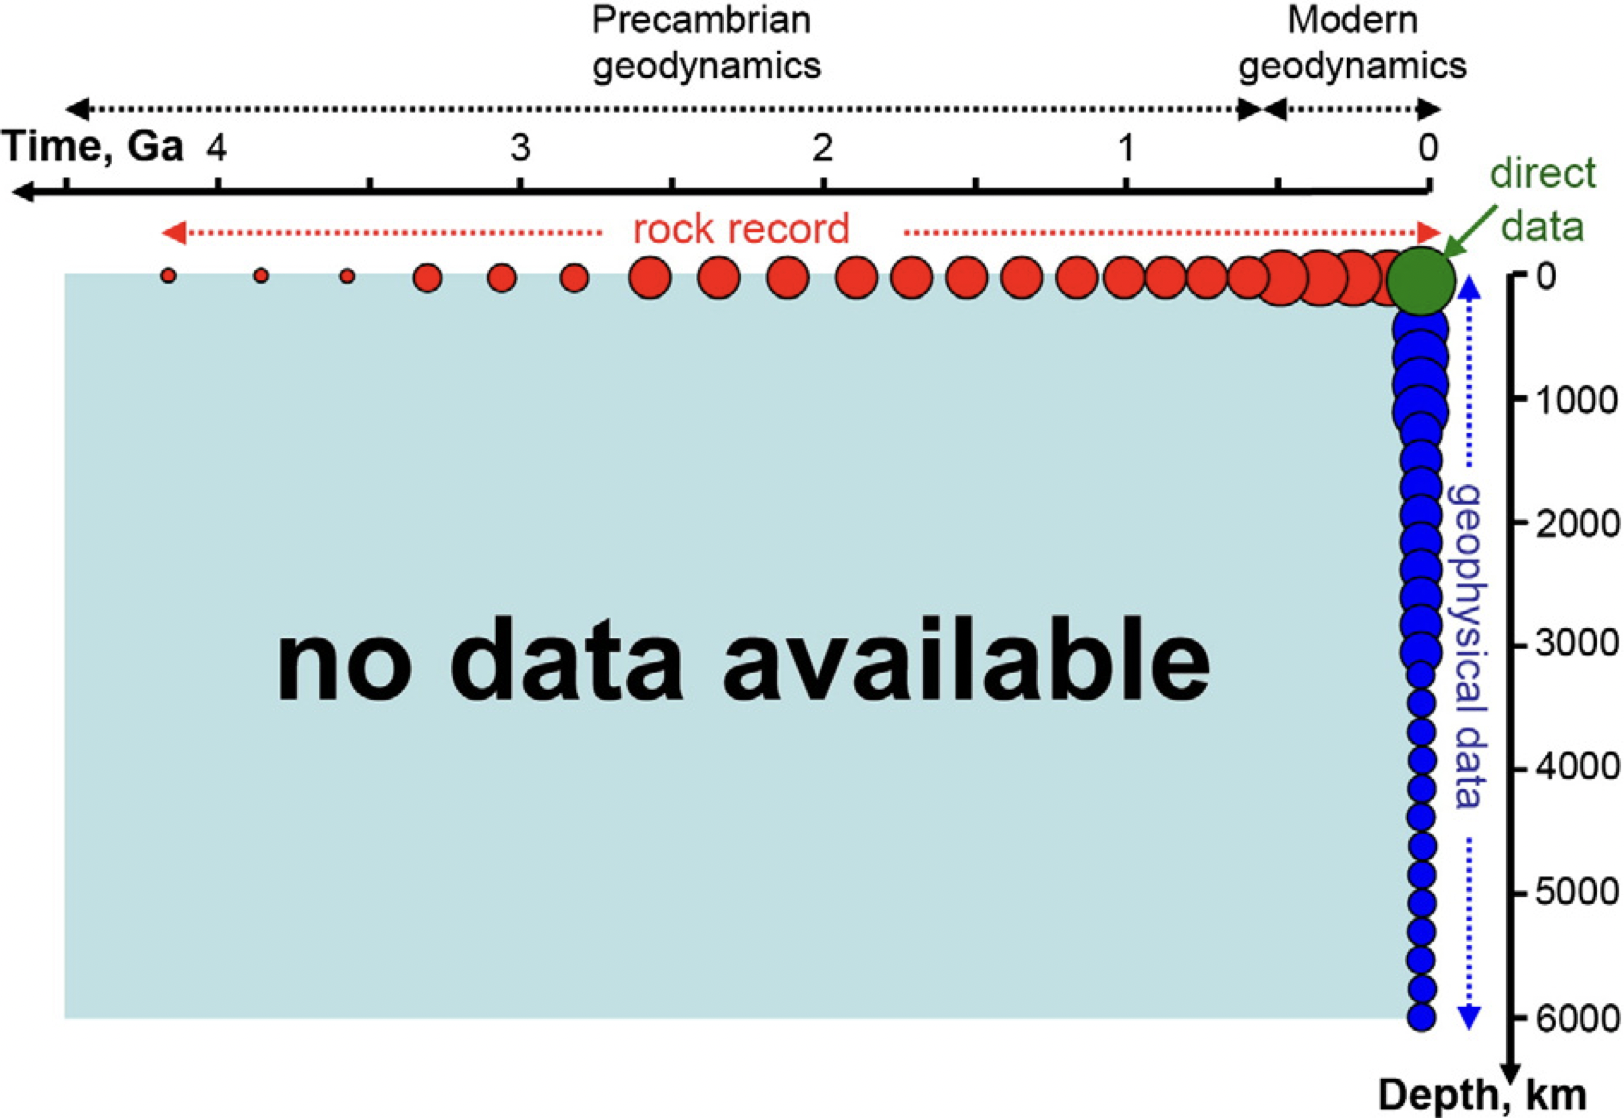
Figure: The Geodynamicist’s dilemma. Time-depth diagram representing the data availability on Earth. The rock record (red circles) encodes information about geodynamic processes throughout Earth’s history, but only within approximately 100 km of Earth’s surface. Geophysical data (blue circles) provide images of Earth’s deep interior, but only since the 20th century CE. Direct observations (green circle) are limited to the present-day surface. Size of the circles represents the abundance of available data. Reprinted from Gerya (2014) with permission.
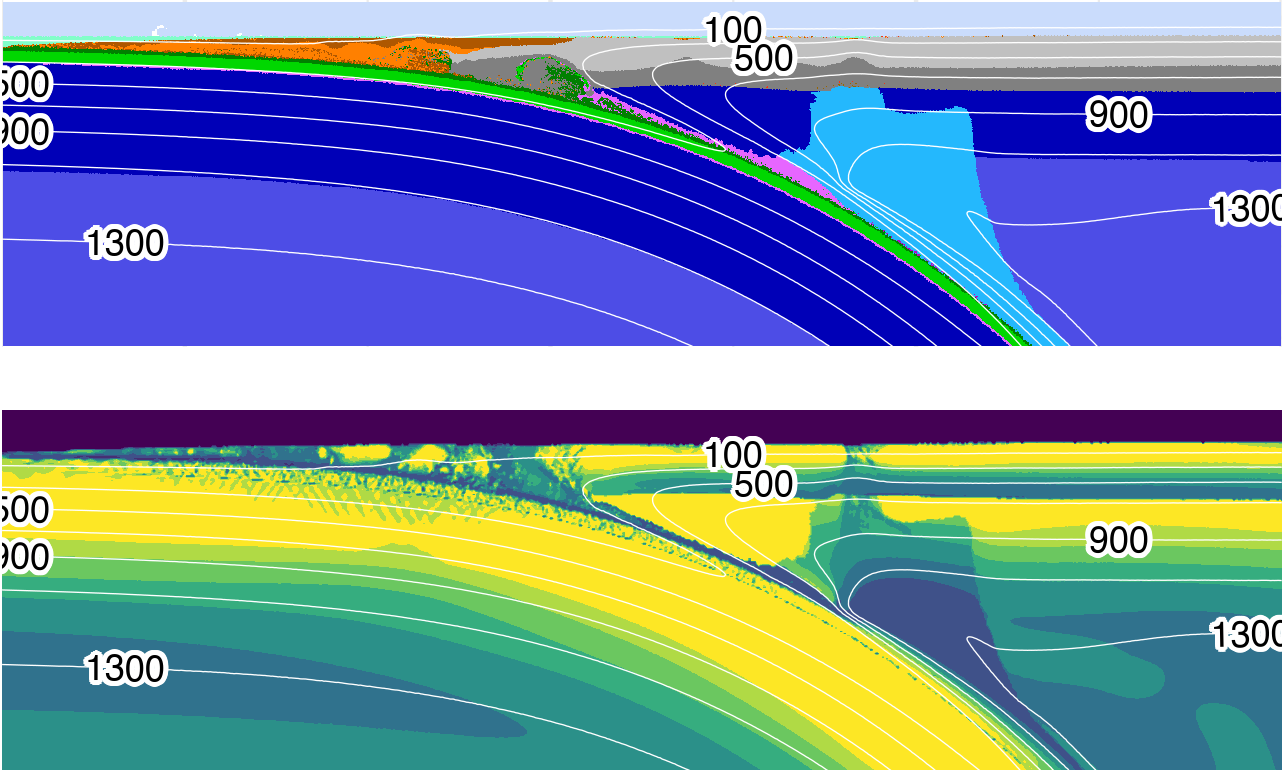
Figure: Visualization s of standard model cdf78 at 5.05 Ma. (top) Rock type. (bottom) Log10 of viscosity. By 5 Ma, balance is achieved between heat sinking from the upper mantle wedge to lower parts of the mantle and strong advection of heat in the circulating part of the mantle wedge. A feedback has already developed—heat advection inhibits antigorite stabilization to greater depths.
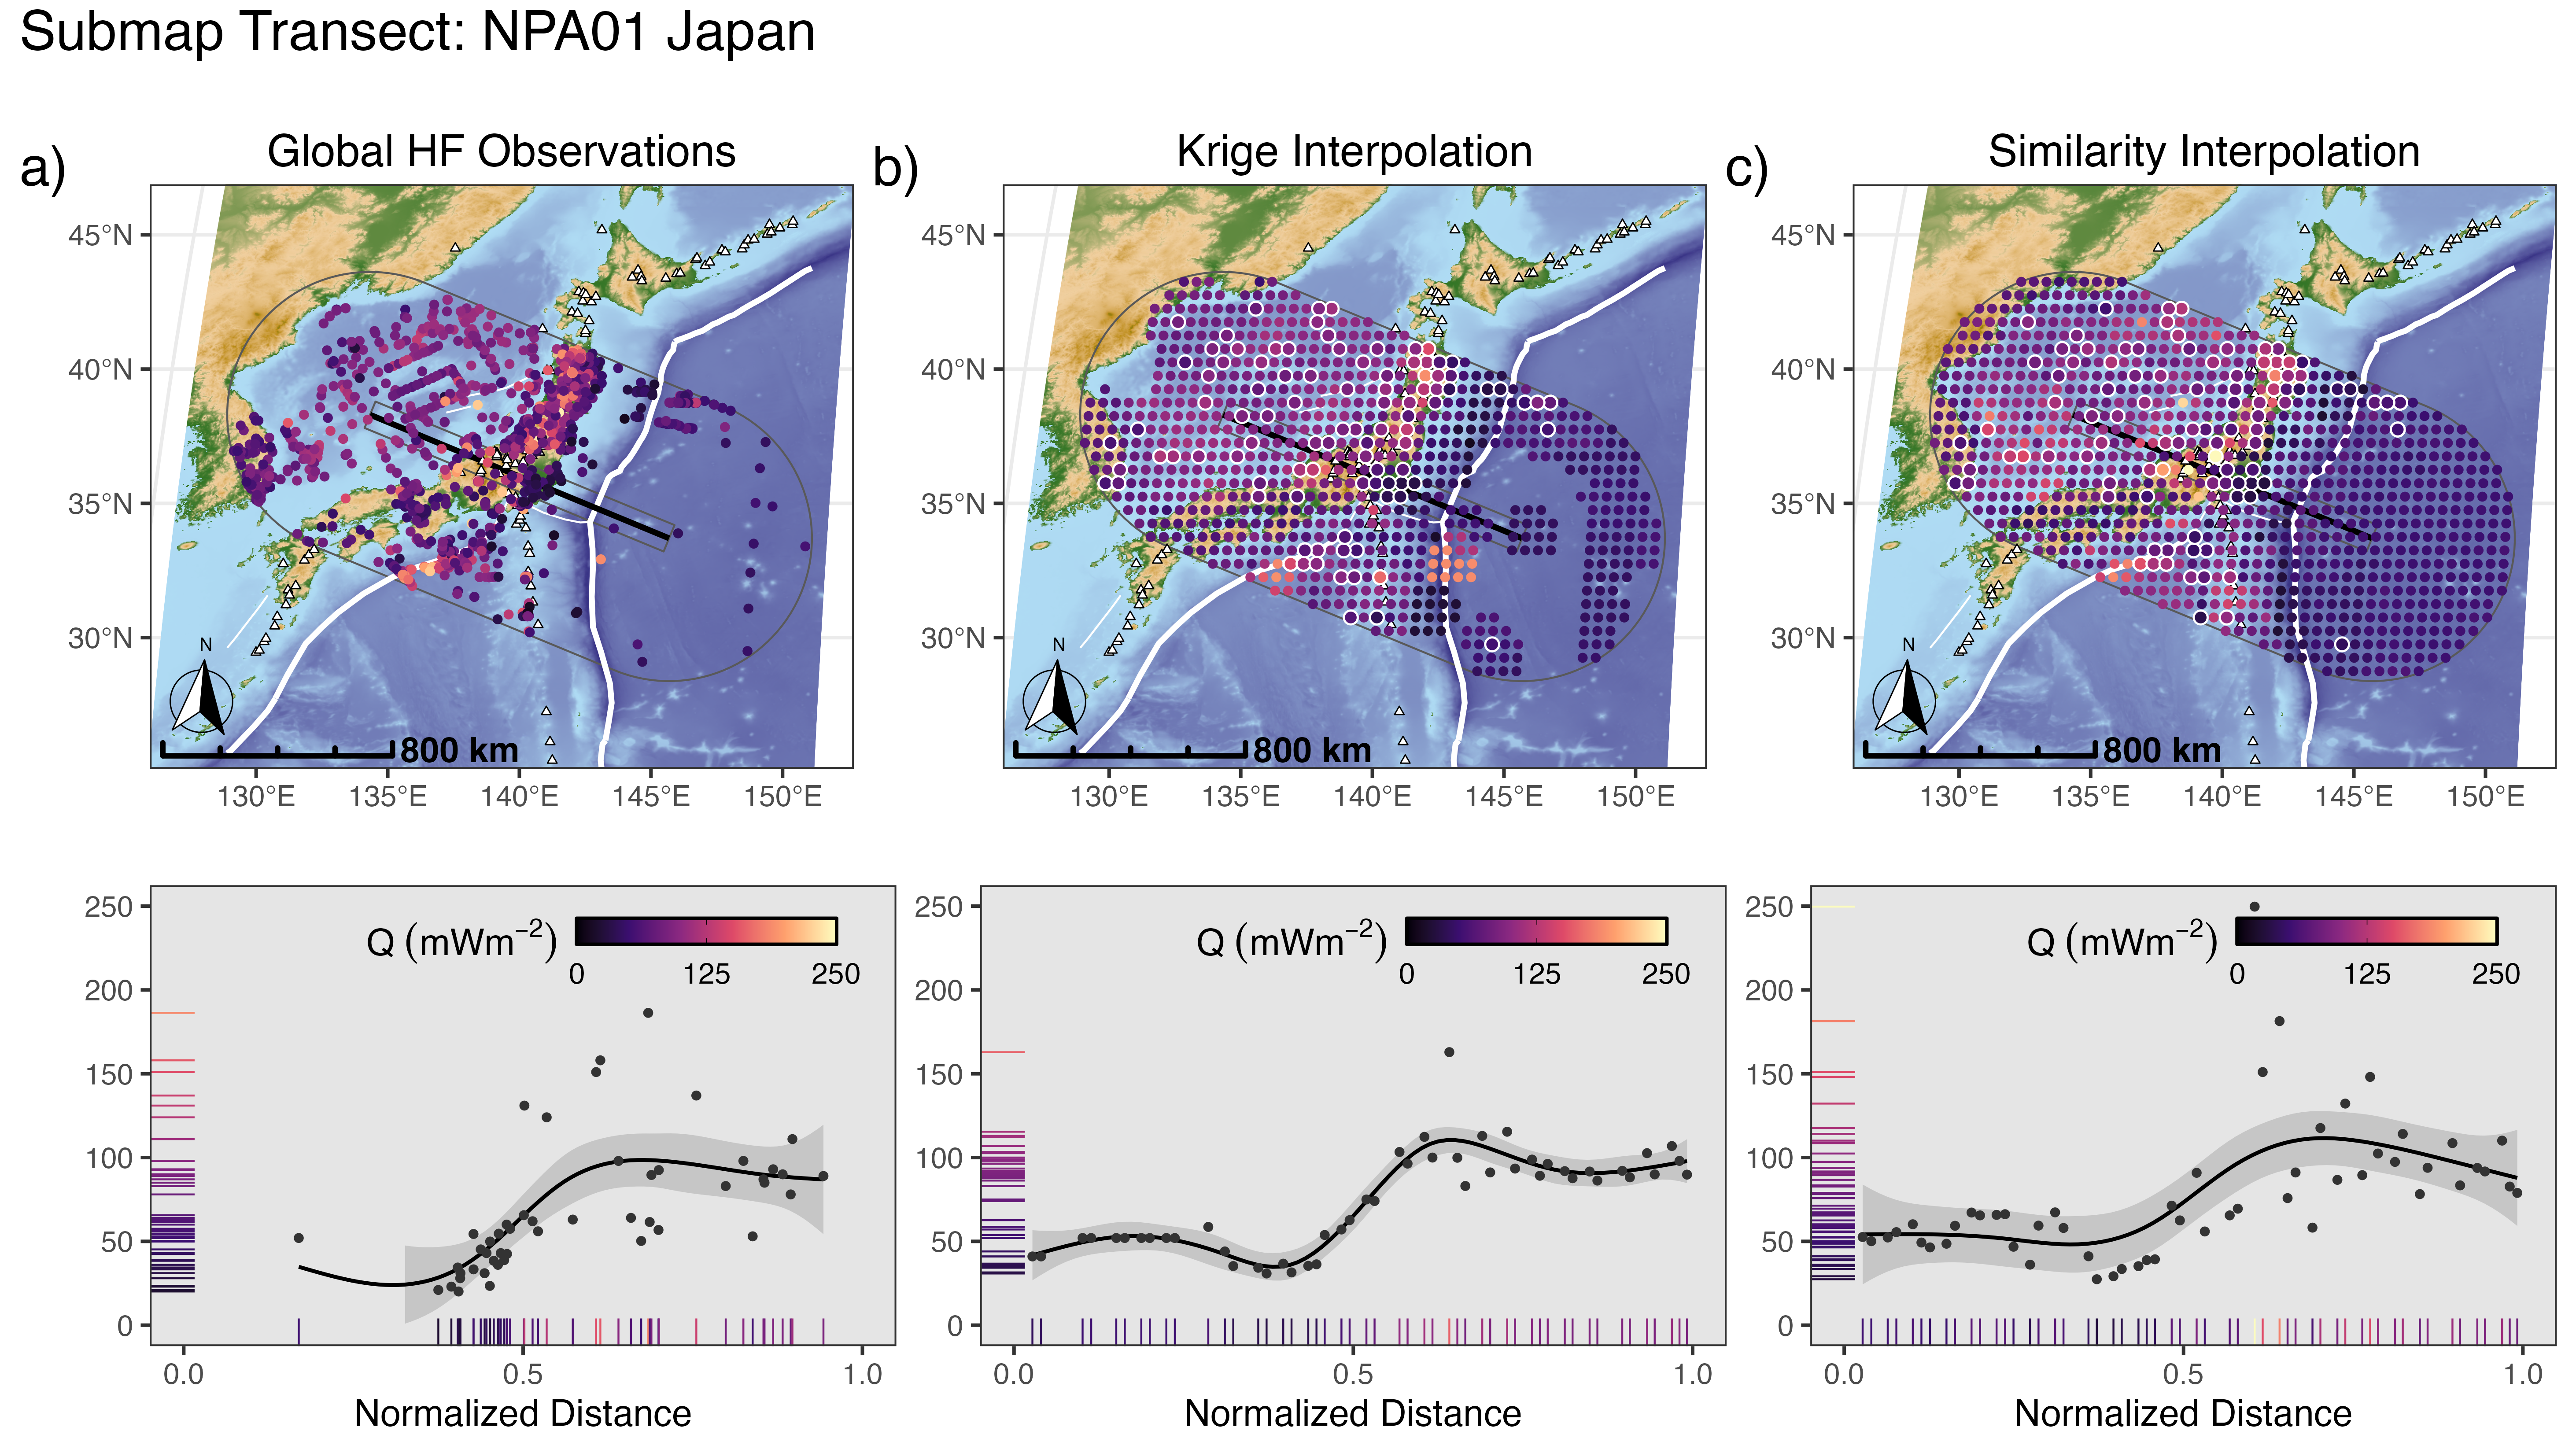
Figure: Global heat flow data compared to (a) Similarity (b) and Kriging (c) interpolations for near Japan. Volcanoes (white triangles) defined by Syracuse & Abers (2006). Global heat flow data from the International Heat Flow Commission 2024 release (Global Heat Flow Data Assessment Group, 2024). Similarity interpolation from Lucazeau (2019). Plate boundaries (thick white lines) defined by Lawver et al. (2018). Transect is from Submap Lallemand & Heuret (2017).
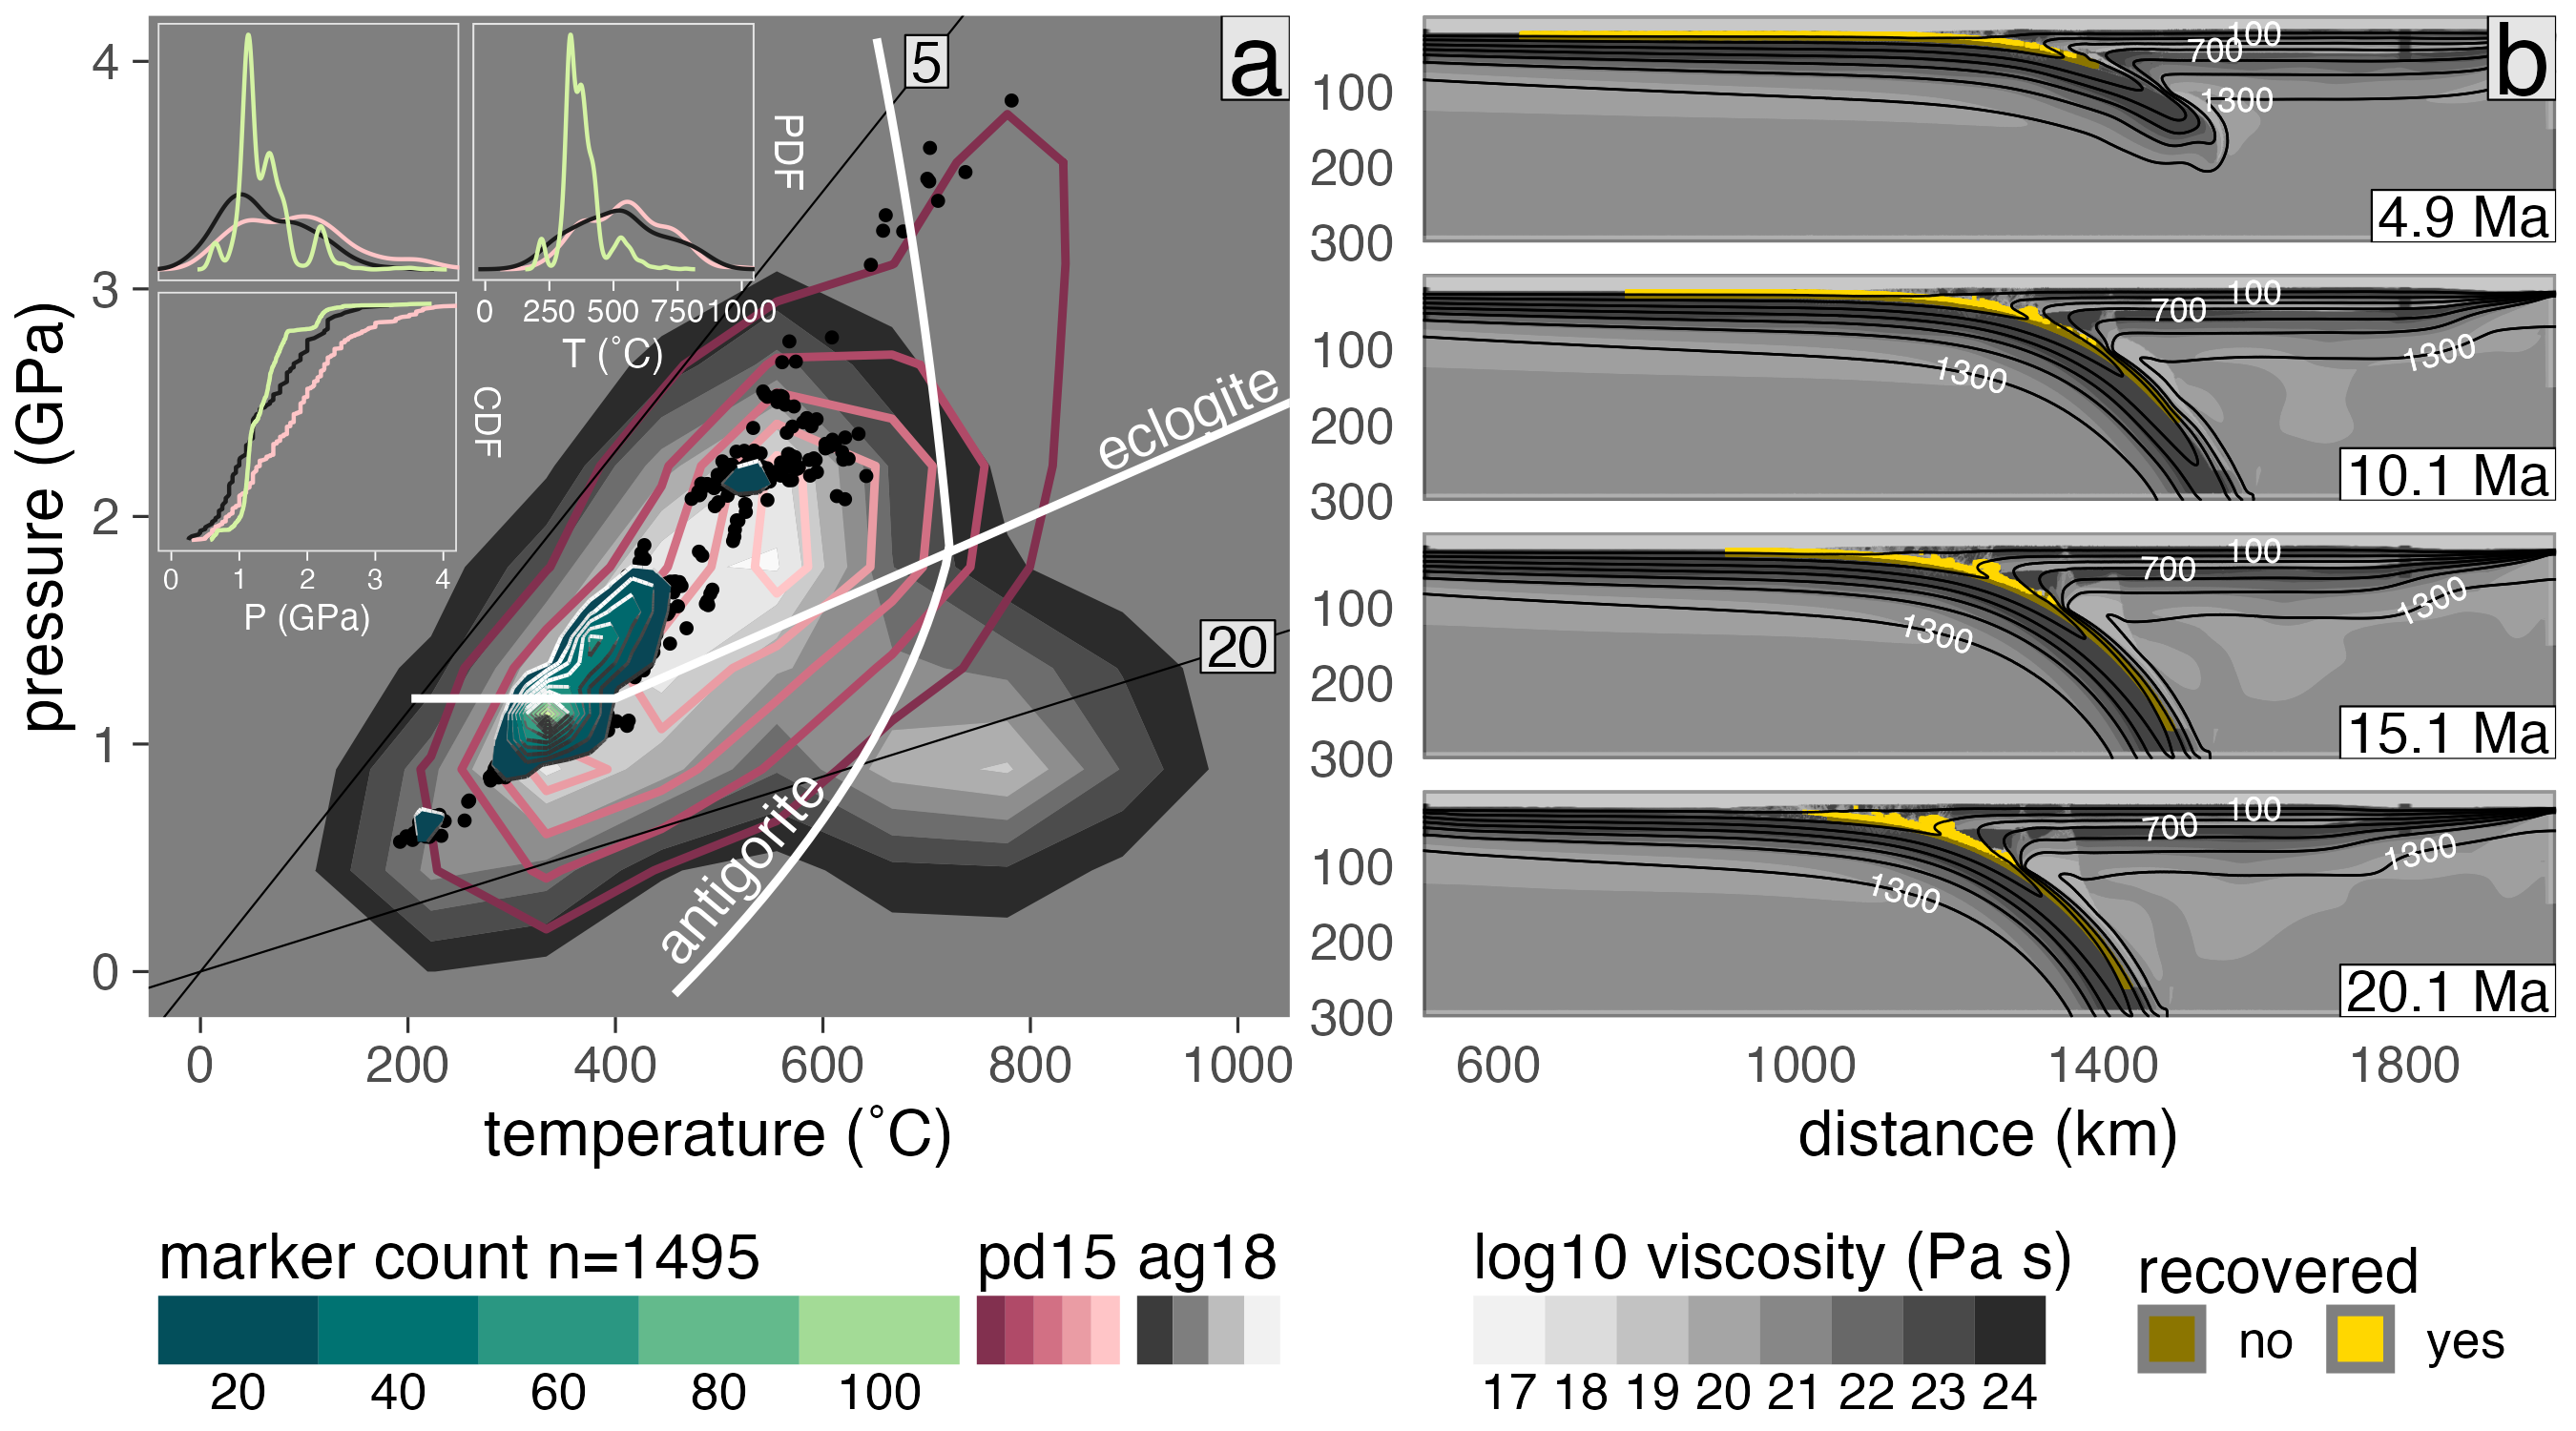
Figure: Summary of marker recovery for model cda62. (a) Pressure-temperature diagram showing the frequency of recovered markers (black points and green Tanaka contours) in comparison with the pd15 (solid red contours) and ag18 (filled gray contours) data sets. Thin lines are thermal gradients labeled in °C/km. Reaction boundaries for eclogitization of oceanic crust and antigorite dehydration are from Ito and Kennedy (1971) and Schmidt and Poli (1998), respectively. Marker counts (Tanaka contours) are computed across a 100 × 100 grid (0.04 GPa × 10°C). (insets) Probability distribution functions (top insets) and cumulative distribution functions (bottom inset) comparing P and T distributions between numerical experiments (green lines) and natural samples (pink lines: pd15, black lines: ag18). (b) Visualization of log viscosity in the model domain showing the major modes of marker recovery along a relatively thick subduction interface that tapers near the viscous coupling depth.
Acknowledgements:
This work was only possible through the efforts of many individuals. My advisor, Dr. Matthew Kohn, deserves special recognition for his contributions, mentorship, and relentless support during the course of my studies. Special thanks to my committee members, Dr. H.P. Marshall, Dr. C.J. Northrup, Dr. Philippe Agard. Thanks to Dr. Steve Utych who served as the Graduate College Representative for Boise State University. Dr. Taras Gerya and the Geophysical Fluid Dynamics group at the Institut für Geophysik, ETH Zürich, generously offered their high-performance computing resources, invaluable instruction, discussion, and support on the numerical modelling methods, and many free meals in Zürich. Additional high-performance computing support was provided by the Research Computing Department at Boise State University. Thanks to Dr. D. Hasterok for providing references and guidance on citing the large dataset in chapter three. Special thanks to Dr. Philippe Agard, Dr. Laetitia Le Pourhiet, and graduate students at Sorbonne Université for their incredible expertise and showing me the best of summertime Paris. Thanks to many anonymous reviewers, graduate students, and colleagues for helpful comments on technical aspects of each chapter. My deep appreciation of metamorphic rocks and Alpine geology was formed thanks to outstanding field excursions expertly guided by EFIRE and ZiP graduate students, faculty, and affiliates. I am especially grateful to Dr. Sarah Penniston-Dorland and Dr. Maureen Feinman for their tireless efforts in organizing those excursions. Funding for this work was provided by the National Science Foundation grant OISE 1545903 awarded to Dr. Matthew Kohn, Dr. Sarah Penniston-Dorland, and Dr. Maureen Feineman. Datasets and code for reproducing this research are available on GitHub.
Abstract:
PT estimates from exhumed HP metamorphic rocks and global surface heat flow observations evidently encode information about subduction zone thermal structure and the nature of mechanical and chemical processing of subducted materials along the interface between converging plates. Previous work demonstrates the possibility of decoding such geodynamic information by comparing numerical geodynamic models with empirical observations of surface heat flow and the metamorphic rock record. However, ambigous interpretations can arise from this line of inquiry with respect to thermal gradients, plate coupling, and detachment and recovery of subducted materials. This dissertation applies a variety of computational techniques to explore changes in plate interface behavior among subduction zones from large numerical and empirical datasets. First, coupling depths for 17 modern subduction zones are predicted after observing mechanical coupling in 64 numerical geodynamic simulations. Second, upper-plate surface heat flow patterns are assessed by applying two methods of interpolation to thousands of surface heat flow observations near subduction zone segments. Third, PT distributions of over one million markers traced from the previous set of 64 subduction simulations are compared with hundreds of empirical PT estimates from the rock record to assess the effects of thermo-kinematic boundary conditions on detachment and recovery of rock along the plate interface. These studies conclude the following. Mechanical coupling between plates is primarily controlled by the upper plate lithospheric thickness, with marginal responses to other thermo-kinematic boundary conditions. Upper-plate surface heat flow patterns are highly variable within and among subduction zone segments, suggesting both uniform and nonuniform subsurface thermal structure and/or geodynamics. Finally, PT distributions of recovered markers show patterns consistent with trimodal detachment (recovery) of rock from distinct depths coinciding with the continental Moho at ~35-40 km, the onset of plate coupling at ~80 km, and an intermediate recovery mode around ~55 km. Together, this work identifies important biases in geodynamic numerical models (insufficient implementation of recovery mechanisms and/or heat generation/transfer), surface heat flow observations (poor spatial coverage and/or oversampling of specific regions), and petrologic datasets (selective sampling of metamorphic rocks amenable to petrologic modelling techniques) that, if addressed, could significantly improve the current understandings of subduction interface behavior.